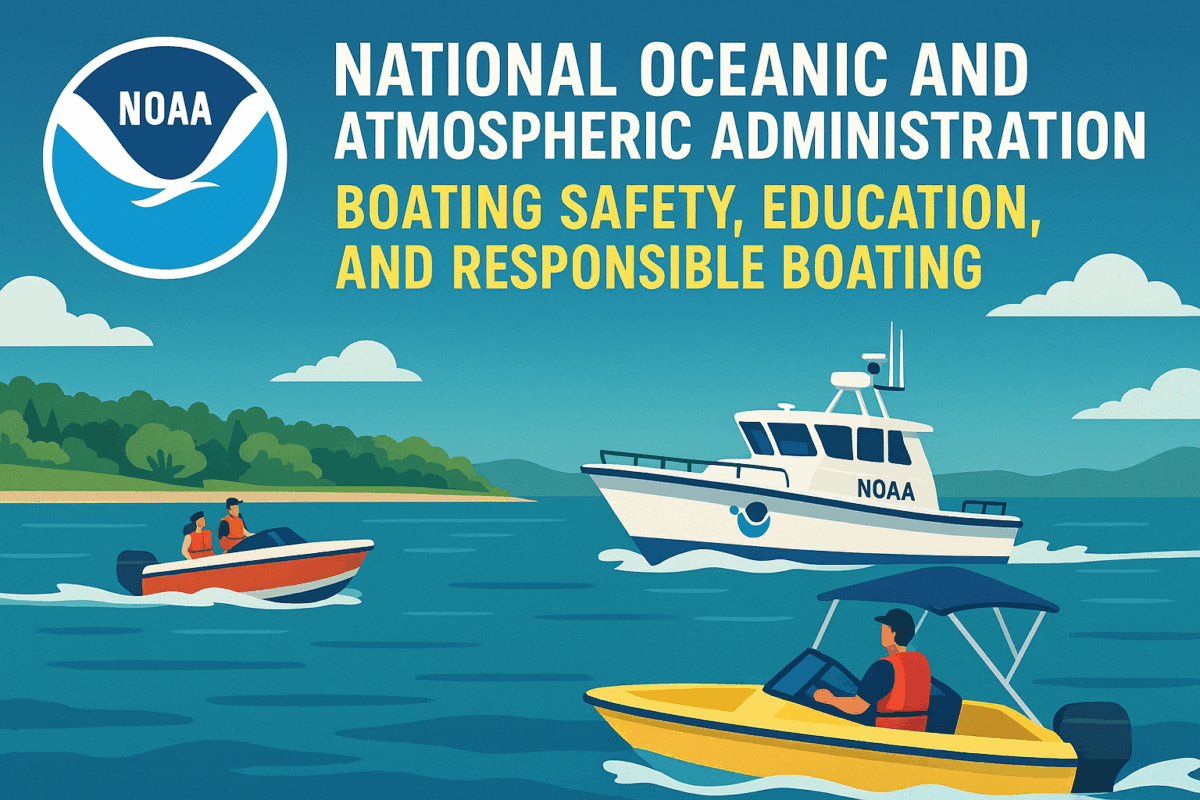
A NOAA patrol vessel monitoring coastal waters, promoting boating safety, education, and certification for responsible and smart boating practices. NOAA Long Island Sound Nautical Charts Overview The NOAA Long Island Sound Nautical Charts image displays detailed electronic chart data for safe navigation across coastal waters. Chart features include depth contours, shoreline details, and aids to navigation. Because accuracy matters, these charts support both recreational and commercial mariners. Navigational Safety Mariners in the image use NOAA ENCs to avoid hazards and plan efficient routes. Real-time positioning enhances safety. As a result, grounding risks decrease. Charting Technology The image highlights NOAA’s shift from paper charts to digital formats. Therefore, users benefit from weekly updates and customizable layouts. Using NOAA Long Island Sound Nautical Charts Understanding NOAA Long Island Sound Nautical Charts helps boaters navigate confidently. Learn more at NOAA Marine Navigation NOAA Chart Number One Overview The NOAA Chart Number One image displays a reference guide showing nautical chart symbols, abbreviations, and terms. It includes side-by-side comparisons of paper and electronic chart symbology. Because clarity matters, this chart helps mariners interpret navigation data accurately. Symbol Reference in Action Mariners in the image use NOAA Chart Number One to identify buoys, depth contours, and restricted areas. As a result, navigation becomes safer. Educational Utility The image highlights how students and instructors use the chart for training. Therefore, it supports both recreational and professional learning environments. Why NOAA Chart Number One Matters Understanding NOAA Chart Number One improves chart reading skills. Learn more at NOAA Chart No. 1. NOAA’s Interactive Global Charts Overview The NOAA’s Interactive Global Charts image displays a digital world map with layered nautical data and real-time satellite overlays. Users can zoom, pan, and select regions to access detailed chart information. Because accuracy matters, the system supports safe navigation and environmental monitoring. Real-Time Data Access Mariners in the image use NOAA’s Interactive Global Charts to view updated ENC data, weather overlays, and oceanographic conditions. As a result, voyage planning improves. Charting Innovation The image highlights NOAA’s shift to digital navigation tools. Therefore, users benefit from weekly updates and customizable chart formats. Why NOAA’s Interactive Global Charts Matter Understanding NOAA’s Interactive Global Charts enhances safety and efficiency. Learn more at NOAA Interactive Catalog. NOAA Coast Pilot Overview The NOAA Coast Pilot image shows a mariner referencing a printed volume alongside electronic charts on a navigation console. The book includes channel descriptions, tide data, and federal regulations. Because accuracy matters, the Coast Pilot supplements nautical charts with critical details. Navigational Support Mariners in the image use the NOAA Coast Pilot to verify bridge clearances and anchorage locations. As a result, voyage planning improves. Historical Significance The image highlights the Coast Pilot’s 200-year legacy. Therefore, it remains a trusted resource for coastal navigation. Why NOAA Coast Pilot Matters Understanding the NOAA Coast Pilot enhances safety and compliance. Learn more at NOAA Coast Pilot. NOAA Homepage Overview The NOAA Homepage image displays a vibrant dashboard featuring weather, climate, ocean, satellite, and fisheries data. Navigation menus highlight NOAA’s mission areas. Because accessibility matters, the homepage offers quick links to forecasts, research, and educational resources. Interactive Features Users in the image explore the NOAA Homepage to access flood mapping tools, hurricane updates, and marine charting services. As a result, decision-making improves. Public Engagement The image shows students, scientists, and boaters using NOAA’s site for learning and planning. Therefore, it supports diverse communities nationwide. Why the NOAA Homepage Matters Understanding the NOAA Homepage helps users stay informed. Visit NOAA.gov for more subjects like NOAA Weather Radio, NOAA Education, BLA Organizations, NOAA 8 Boating Safety Tips, NOAA Be Kind to Nature, NOAA Coast Pilot Books, NOAA Electronic Navigational Charts, NWS Video Library, Climate Data Online, Do We Need Lighthouses, NOAA Blue IQ, Ocean to Atmosphere, Women of NOAA, NOAA Sanctuaries, The Best Weather Website, NOAA Marine Debris Program, NOAA Interactive Maps, ADVs,

The Best Weather Website

In by admin

The best weather website has to be NOAA and the National Weather Service.


Building a Weather-Ready Nation and managing the nation’s weather, water, and climate data, forecasts and warnings requires a diversified organization. From the National Weather Service (NWS) Headquarters in Silver Spring, MD to six Regional Headquarters: EasternSouthernCentralWesternAlaska, and Pacific; to local Weather Forecast Offices (WFOs), River Forecast Centers (RFCs), Center Weather Service Units (CWSUs), and National Centers nationwide. NWS employees are working to support all aspects of keeping the public safe from weather, water, and climate hazards. All while meeting the NWS mission to protect lives and property, and enhance the national economy.

NWS Headquarters, the best weather website, is responsible for managing the functions of the entire NWS. Headquarters coordinates programs directly related to weather warnings and forecasting to ensure the compatibility and effectiveness of weather services. It also ensures climate, water, and weather warnings, forecasts, and data products are provided to government, industry, and the general public. The NWS Headquarters also ensures funding is available to support field needs. Furthermore, it manages information technology resources, and ensures a coordinated NOAA program of weather-related activities across NOAA line offices. Visit the Best Weather Website.

The six NWS regional offices manage all operational and scientific meteorological, hydrologic, and oceanographic programs of the region including observing networks, weather services, forecasting, and climatology and hydrology. They monitor these services and adjust resources to provide the most effective weather and warning services possible.

The National Centers for Environmental Prediction (NCEP) delivers science-based environmental predictions. It produces reliable, timely, and accurate analyses, guidance, forecasts and warnings for the protection of lives and property. Let alone the enhancement of the national economy. NCEP is comprised of nine distinct centers. They are the Aviation Weather Center, Climate Prediction Center, National Hurricane Center, Storm Prediction Center, Space Weather Prediction Center, Weather Prediction Center, Ocean Prediction Center, Environmental Modeling Center, and NCEP Central Operations. NCEP is the starting point for nearly all weather forecasts in the United States.

The local WFOs are responsible for issuing advisories, warnings, statements, and short term forecasts. These are for their local county warning area including the public, media, emergency management, aviation community, and other customers 24/365. This helps to keep the public safe from weather hazards. More specifically, forecasters prepare graphical and digital forecasts, issue warnings, watches, and advisories, aviation forecasts, and river forecasts and warnings. They monitor weather observations, provide public service, and program/monitor broadcasts over eleven NOAA Weather Radio-All Hazards Stations. They also collect and disseminate river and rainfall data, launch balloons to gather upper-air weather data, administer the Cooperative Weather Observer Program, and prepare local climatological data summaries and reports.

The Helm for all boaters CT DEEP, NASBLA, NOAA, USCG, WSIA