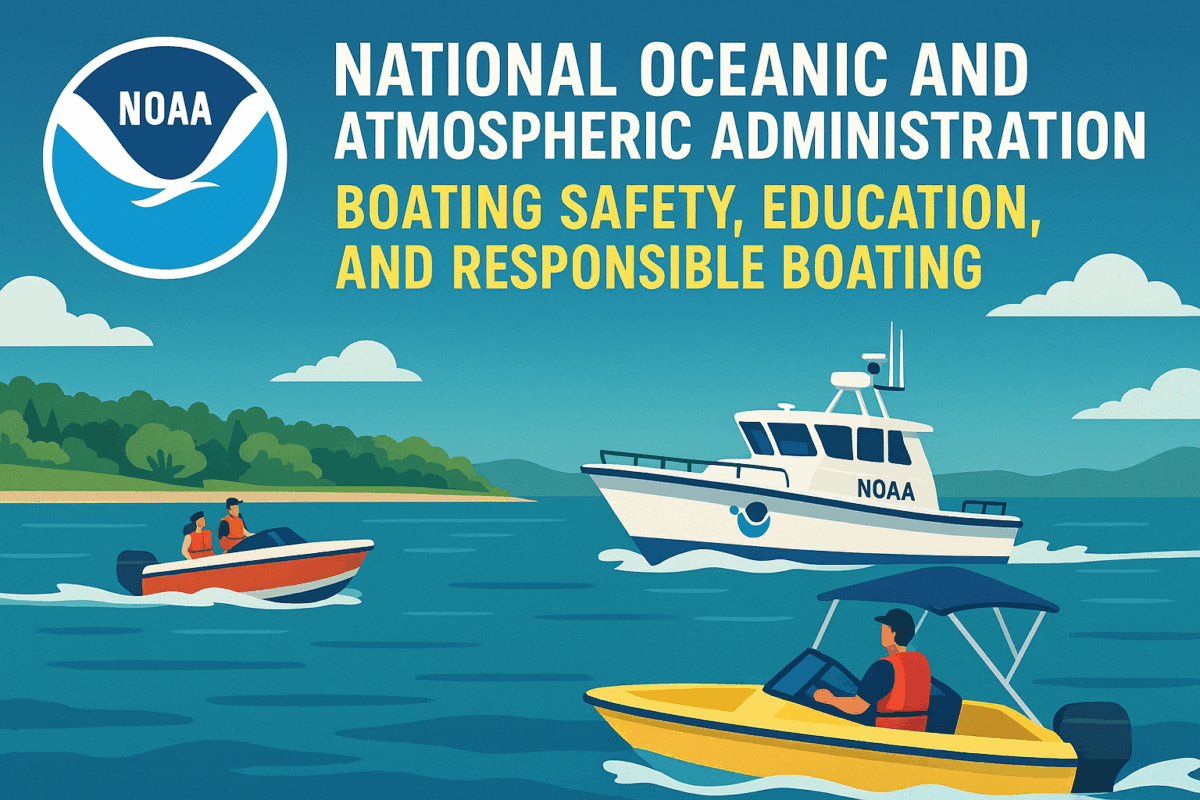
A NOAA patrol vessel monitoring coastal waters, promoting boating safety, education, and certification for responsible and smart boating practices. NOAA Long Island Sound Nautical Charts Overview The NOAA Long Island Sound Nautical Charts image displays detailed electronic chart data for safe navigation across coastal waters. Chart features include depth contours, shoreline details, and aids to navigation. Because accuracy matters, these charts support both recreational and commercial mariners. Navigational Safety Mariners in the image use NOAA ENCs to avoid hazards and plan efficient routes. Real-time positioning enhances safety. As a result, grounding risks decrease. Charting Technology The image highlights NOAA’s shift from paper charts to digital formats. Therefore, users benefit from weekly updates and customizable layouts. Using NOAA Long Island Sound Nautical Charts Understanding NOAA Long Island Sound Nautical Charts helps boaters navigate confidently. Learn more at NOAA Marine Navigation NOAA Chart Number One Overview The NOAA Chart Number One image displays a reference guide showing nautical chart symbols, abbreviations, and terms. It includes side-by-side comparisons of paper and electronic chart symbology. Because clarity matters, this chart helps mariners interpret navigation data accurately. Symbol Reference in Action Mariners in the image use NOAA Chart Number One to identify buoys, depth contours, and restricted areas. As a result, navigation becomes safer. Educational Utility The image highlights how students and instructors use the chart for training. Therefore, it supports both recreational and professional learning environments. Why NOAA Chart Number One Matters Understanding NOAA Chart Number One improves chart reading skills. Learn more at NOAA Chart No. 1. NOAA’s Interactive Global Charts Overview The NOAA’s Interactive Global Charts image displays a digital world map with layered nautical data and real-time satellite overlays. Users can zoom, pan, and select regions to access detailed chart information. Because accuracy matters, the system supports safe navigation and environmental monitoring. Real-Time Data Access Mariners in the image use NOAA’s Interactive Global Charts to view updated ENC data, weather overlays, and oceanographic conditions. As a result, voyage planning improves. Charting Innovation The image highlights NOAA’s shift to digital navigation tools. Therefore, users benefit from weekly updates and customizable chart formats. Why NOAA’s Interactive Global Charts Matter Understanding NOAA’s Interactive Global Charts enhances safety and efficiency. Learn more at NOAA Interactive Catalog. NOAA Coast Pilot Overview The NOAA Coast Pilot image shows a mariner referencing a printed volume alongside electronic charts on a navigation console. The book includes channel descriptions, tide data, and federal regulations. Because accuracy matters, the Coast Pilot supplements nautical charts with critical details. Navigational Support Mariners in the image use the NOAA Coast Pilot to verify bridge clearances and anchorage locations. As a result, voyage planning improves. Historical Significance The image highlights the Coast Pilot’s 200-year legacy. Therefore, it remains a trusted resource for coastal navigation. Why NOAA Coast Pilot Matters Understanding the NOAA Coast Pilot enhances safety and compliance. Learn more at NOAA Coast Pilot. NOAA Homepage Overview The NOAA Homepage image displays a vibrant dashboard featuring weather, climate, ocean, satellite, and fisheries data. Navigation menus highlight NOAA’s mission areas. Because accessibility matters, the homepage offers quick links to forecasts, research, and educational resources. Interactive Features Users in the image explore the NOAA Homepage to access flood mapping tools, hurricane updates, and marine charting services. As a result, decision-making improves. Public Engagement The image shows students, scientists, and boaters using NOAA’s site for learning and planning. Therefore, it supports diverse communities nationwide. Why the NOAA Homepage Matters Understanding the NOAA Homepage helps users stay informed. Visit NOAA.gov for more subjects like NOAA Weather Radio, NOAA Education, BLA Organizations, NOAA 8 Boating Safety Tips, NOAA Be Kind to Nature, NOAA Coast Pilot Books, NOAA Electronic Navigational Charts, NWS Video Library, Climate Data Online, Do We Need Lighthouses, NOAA Blue IQ, Ocean to Atmosphere, Women of NOAA, NOAA Sanctuaries, The Best Weather Website, NOAA Marine Debris Program, NOAA Interactive Maps, ADVs,

NOAA Ocean to Atmosphere

In by admin

NOAA Ocean to Atmosphere Research Connects Climate, Weather, and Marine Science

The NOAA Ocean to Atmosphere initiative explores how oceanic conditions influence weather patterns, climate systems, and atmospheric behavior. This research helps scientists understand the complex interactions between sea surface temperatures, wind patterns, and storm formation. Because oceans store and release vast amounts of heat, they play a critical role in shaping global climate. NOAA uses satellites, buoys, and research vessels to collect data and improve forecasting. By studying these connections, scientists can better predict extreme weather and long-term climate shifts.

Understanding the Ocean’s Role in Weather Systems

Oceans drive many of the Earth’s weather systems through heat exchange and moisture transfer. Warm waters fuel hurricanes, while cold currents influence wind patterns. Because these processes affect rainfall, droughts, and storm intensity, NOAA monitors them closely. The agency uses real-time data to improve seasonal forecasts and early warning systems. Accurate predictions help communities prepare for natural disasters and reduce economic losses. Understanding ocean-atmosphere dynamics is essential for public safety and environmental planning.

NOAA Ocean to Atmosphere Tools and Technology

The NOAA Ocean to Atmosphere program relies on advanced tools to gather and analyze environmental data. Satellites track sea surface temperatures, while buoys measure salinity, currents, and wave height. Aircraft and ships collect atmospheric samples and ocean profiles. Because technology evolves rapidly, NOAA continuously upgrades its systems to enhance accuracy. These tools support climate models, weather forecasts, and marine ecosystem studies. By integrating data from multiple sources, scientists gain a clearer picture of Earth’s interconnected systems.

Supporting Climate Resilience Through Research

NOAA’s research helps policymakers, educators, and communities make informed decisions about climate adaptation. Rising sea levels, shifting storm tracks, and changing precipitation patterns all stem from ocean-atmosphere interactions. Because these changes affect agriculture, infrastructure, and public health, understanding them is vital. The NOAA Ocean to Atmosphere initiative provides the science needed to guide sustainable solutions. Educational outreach and public data access ensure that everyone benefits from this knowledge. Informed action leads to stronger, more resilient communities.

The Helm where boaters get informed, NASBLA, CT DEEP, NOAA